Total shareholder return
Description: TSR measures the change in our share price over the year, assuming that dividends paid are reinvested. This reflects our commitment to delivering enhanced returns for our shareholders through executing our strategy over the medium term. TSR is a key metric used in setting the long-term incentive plan remuneration for both the Executive Directors and senior managers.
Our performance: TSR was -45.8 per cent, compared with -33.3 per cent for the FTSE 350 Real Estate index. This reflects a combination of the 25.0 pence dividend (16.9 pence 2021 final dividend and 8.1 pence 2022 interim dividend) paid during the year, and a reduction in the share price from 1,436.5 pence at 31 December 2021 to 763.6 pence at 31 December 2022.

Total property return
Description: TPR is the ungeared combined income and capital return from our portfolio of standing investments held throughout the year. It is an important measure of the success of our strategy in terms of asset selection and management. MSCI Real Estate prepares the calculation, as well as providing benchmark TPR data for similar properties in their wider universe. We aim to outperform the benchmark over the long term. Details on how TPR impacts short- and long-term incentives are provided on pages 126 to 127.
Our performance: The TPR of the Group’s standing assets held throughout 2022 was -10.3 per cent (2021: +33.7 per cent). The UK portfolio generated a TPR of -13.0 per cent, performing ahead of the benchmark calculated by MSCI Real Estate UK All Industrial Quarterly of -14.6 per cent. The TPR of our Continental Europe portfolio was -5.4 per cent. Benchmark data for Continental Europe will be received later in the year.

Total accounting return
What it is: TAR is the growth in Adjusted NAV per share plus dividends paid, expressed as a percentage of Adjusted NAV per share at 31 December 2021. It measures the return on capital and is a key metric used in setting the long-term incentive plan remuneration for both the Executive Directors and senior managers.
Our performance: The TAR for the Group was -12.8 per cent (2021: +42.5 per cent). This performance reflects a combination of the 171 pence decrease in Adjusted NAV from 1,137 pence at December 2021 to 966 pence at 31 December 2022 and the 25.0 pence dividend (16.9 pence 2021 final dividend and 8.1 pence 2022 interim dividend) paid during the year.

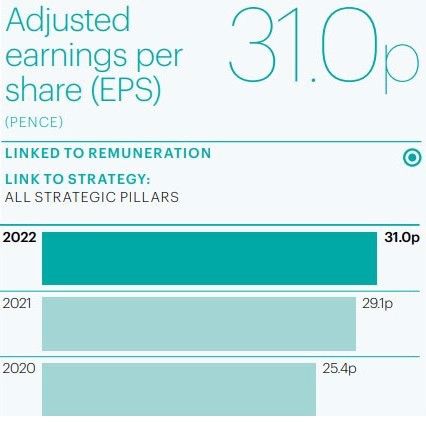
Adjusted EPS (pence)
Description: Our Adjusted EPS reflects earnings from our operating business: rental income less operating, administrative and financing costs and tax. It is the primary determinant of the level of the annual dividend. IFRS EPS includes the impact of realised and unrealised changes in the valuation of our assets, which can often mask the underlying operating performance. The reconciliation between Basic EPS and Adjusted EPS can be found in Note 12(i) on page 178.
Our performance: Adjusted EPS increased by 6.5 per cent to 31.0 pence during the year (10.7 per cent excluding the 1.1 pence SELP performance fee reflected in the 2021 comparator), reflecting higher rental income from our standing assets and new income from acquisitions and developments, partially offset by higher financing costs.
Rent roll growth
Description: The headline annualised rent contracted during the year less income lost from takebacks. There are two elements: to grow income from our standing assets by reducing vacancy and increasing rents from lease renewals and rent reviews; and to generate new rent by developing buildings, either on a pre-let or speculative basis. Rent from acquisitions is not included.
Our performance: In total, we generated a record £77 million of net new annualised rent during the year (2021: £72 million). The increase was driven by higher rents on review and renewal in the UK, indexation provisions mainly in Continental European leases, and by the increased volume of rent from development completions and pre-let agreements secured during the year.

Loan to value
Description: The proportion of our property assets funded by borrowings, including joint ventures and associates at share. The timing of investment decisions and disposals, as well as movement in the value of our assets, may cause the LTV to fluctuate. We believe that REITs with lower through-cycle leverage offer a lower risk and less volatile investment proposition for shareholders.
Our performance: Our LTV ratio increased to 32 per cent during 2022. This was due to a combination of the £2.2 billion unrealised fall in the value of our portfolio and £1.3 billion of net investment in our business. We recognise that this is above recent levels, but given where we are in the cycle we are comfortable with this level. We retain significant headroom to covenants as well as liquidity to fund both visible investment and potential opportunities that may arise.
